
My Requests Overview
Let your users see their recently made API requests and debug issues right from your docs
Thanks to the Getting Started and Authentication pages in your API Reference, it’s a lot easier for new users to get started with your API. They’ve got their API keys front and center, can make authenticated requests from your docs, copy and paste code snippets, and see responses in real-time.
Once they’re really cooking with your API, it’s somewhat inevitable that they’ll run into issues, and when they do, it’s helpful to offer tools that enable them to debug on their own, rather than solely relying on your support team for assistance.
Allow us to introduce My Requests to the rescue 🦸
Dig Into the Details of Your Requests 🔍
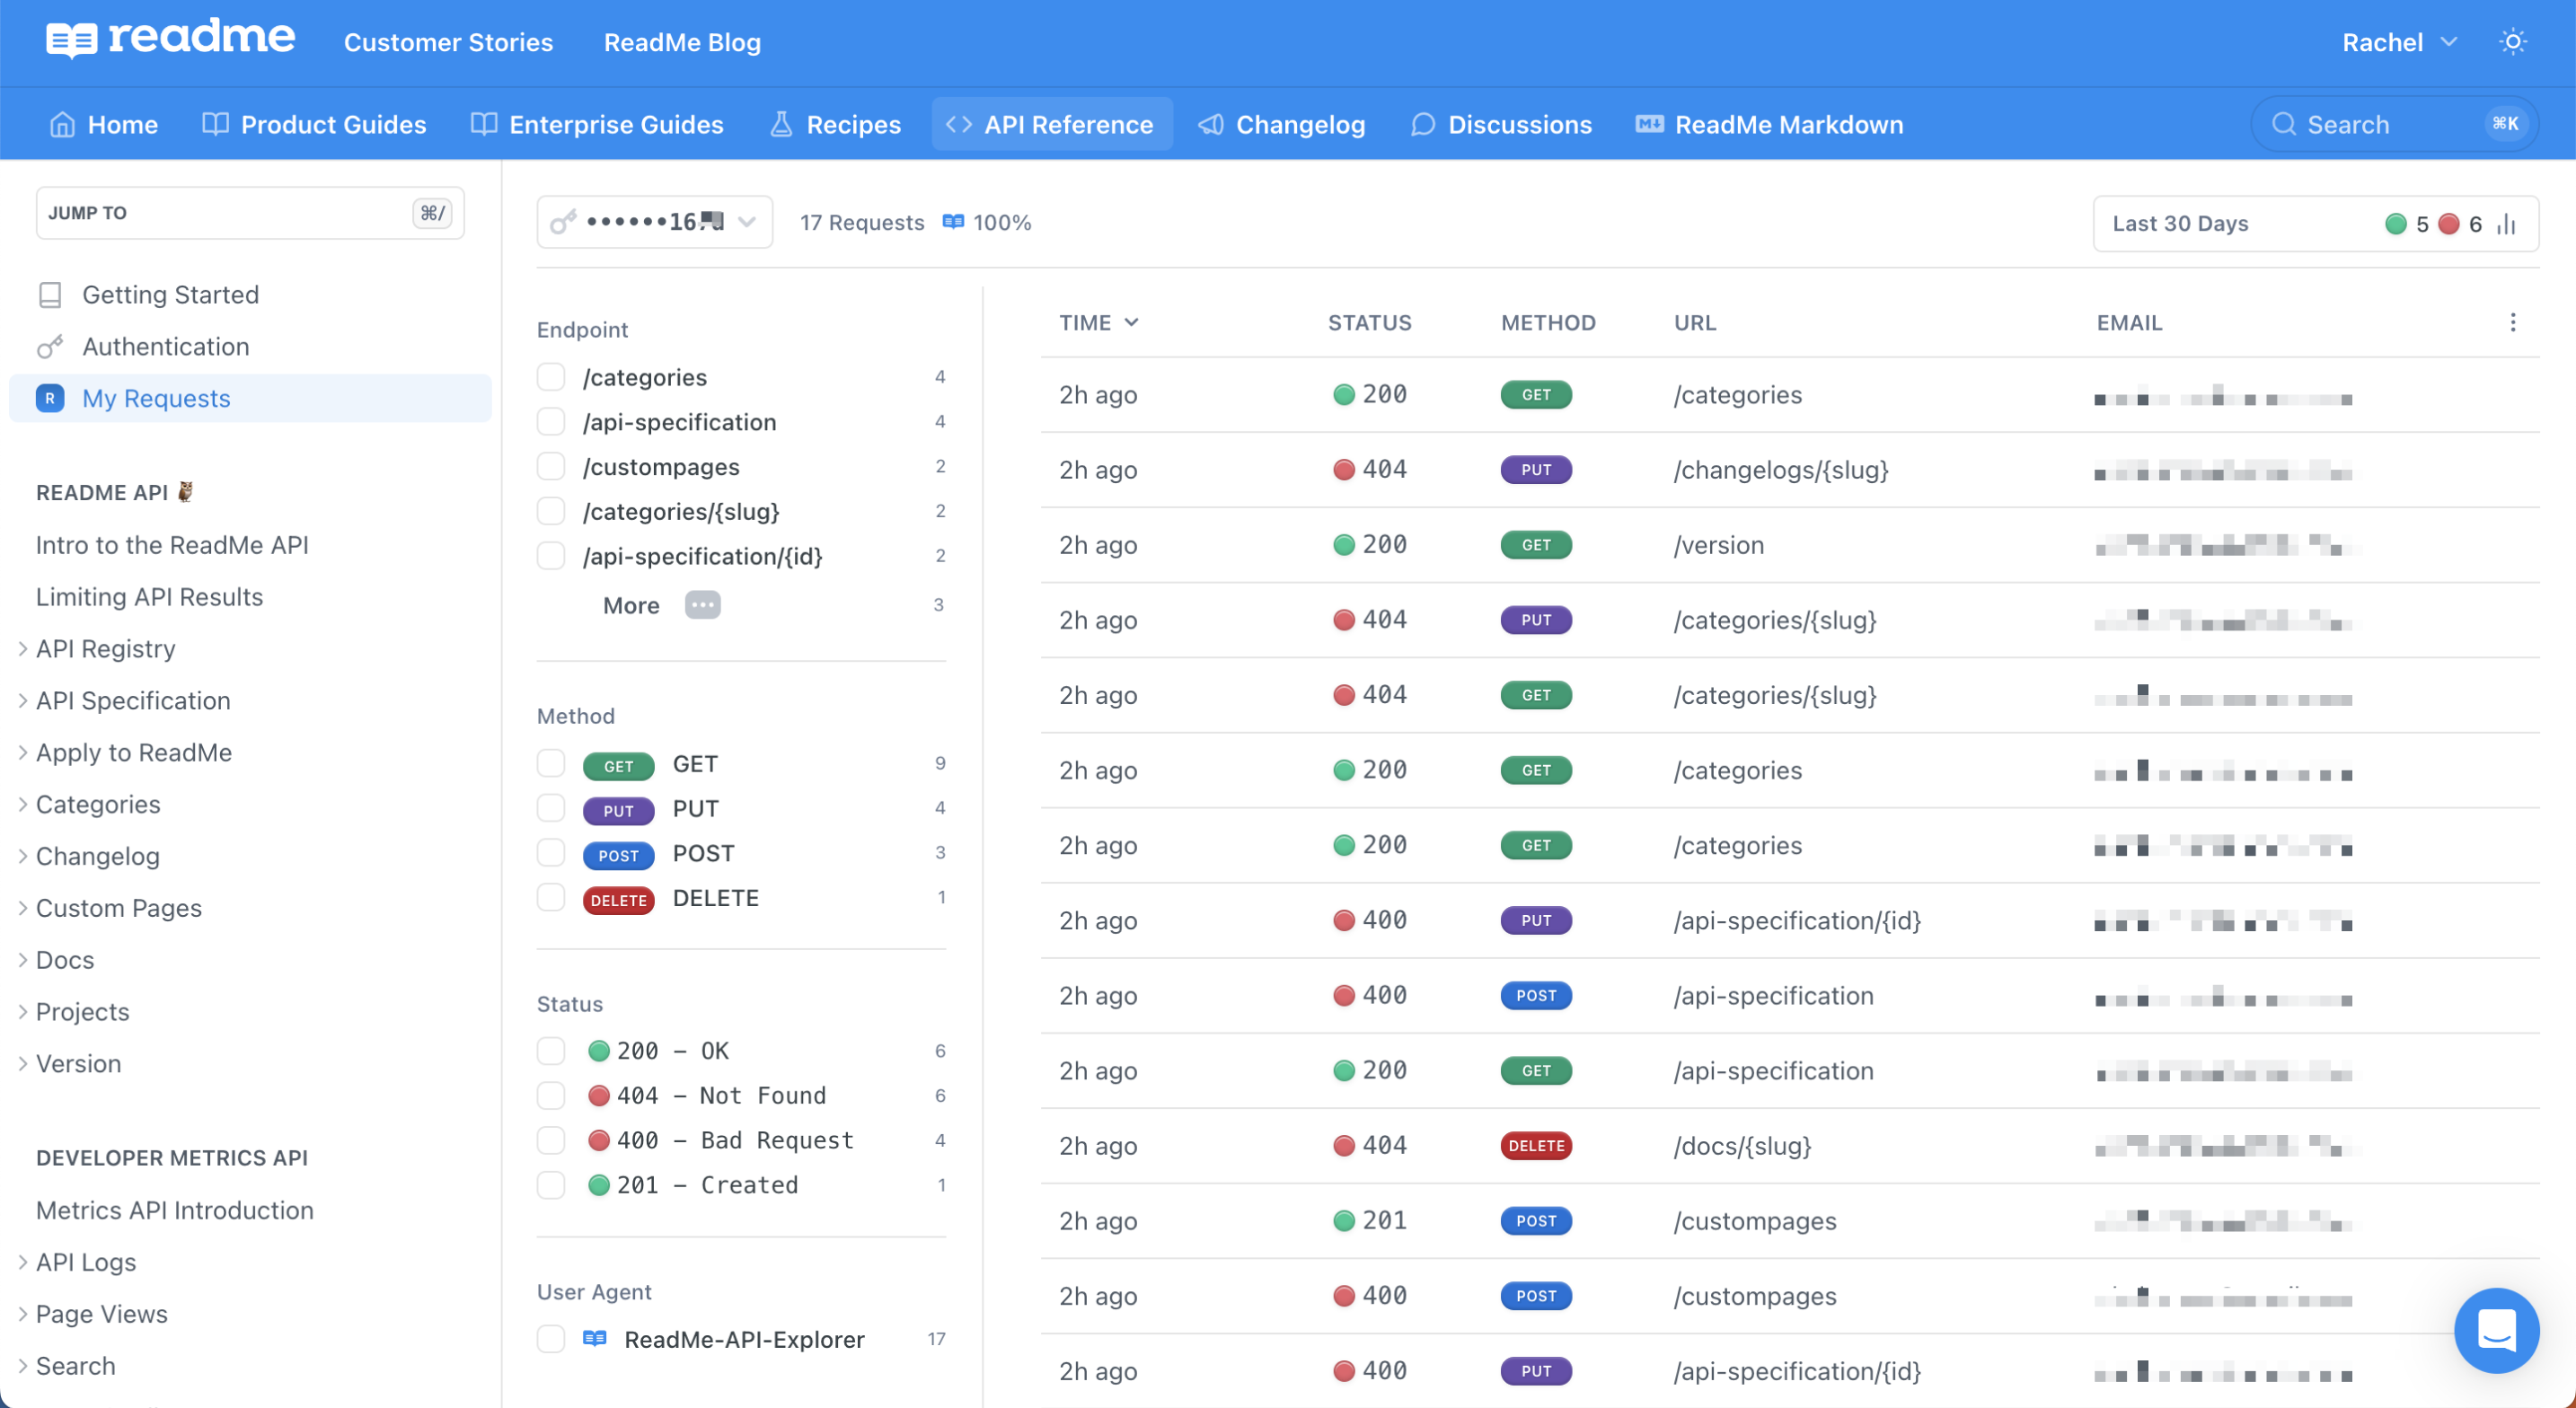
The My Requests page gives logged-in users direct access to their API logs, right from your hub, so they can get a jumpstart on debugging issues, in addition to having a record of all of their API calls.
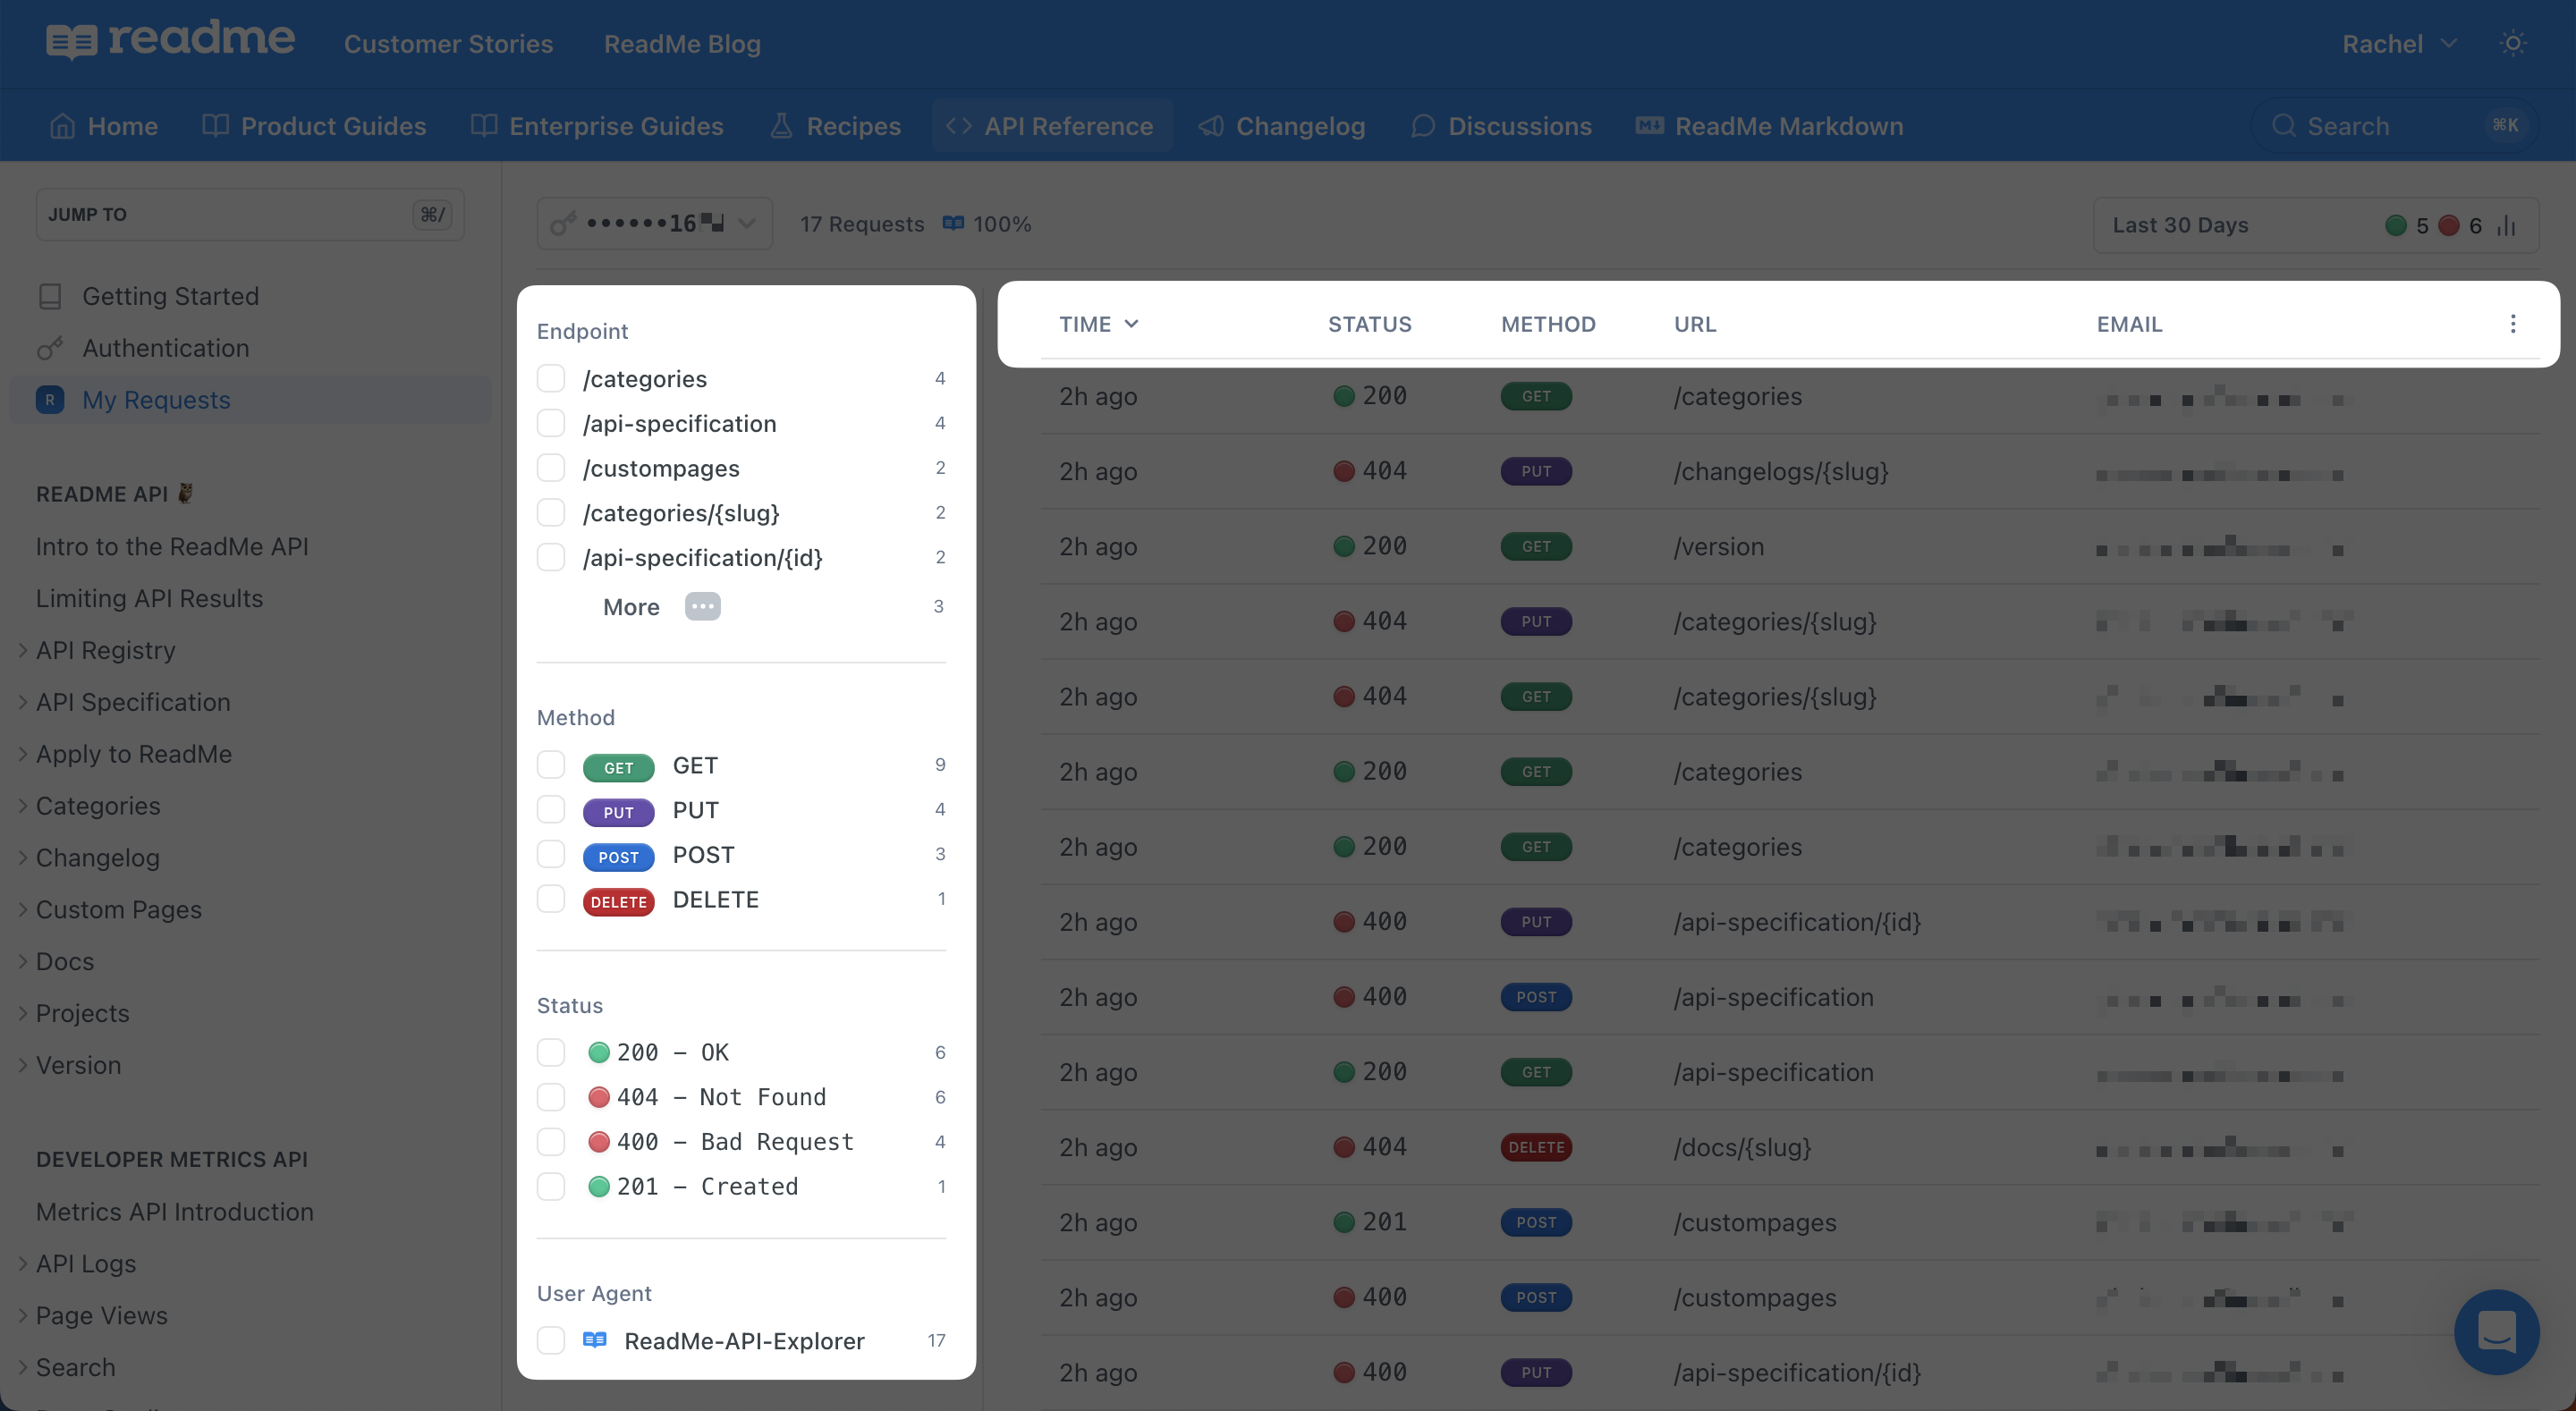
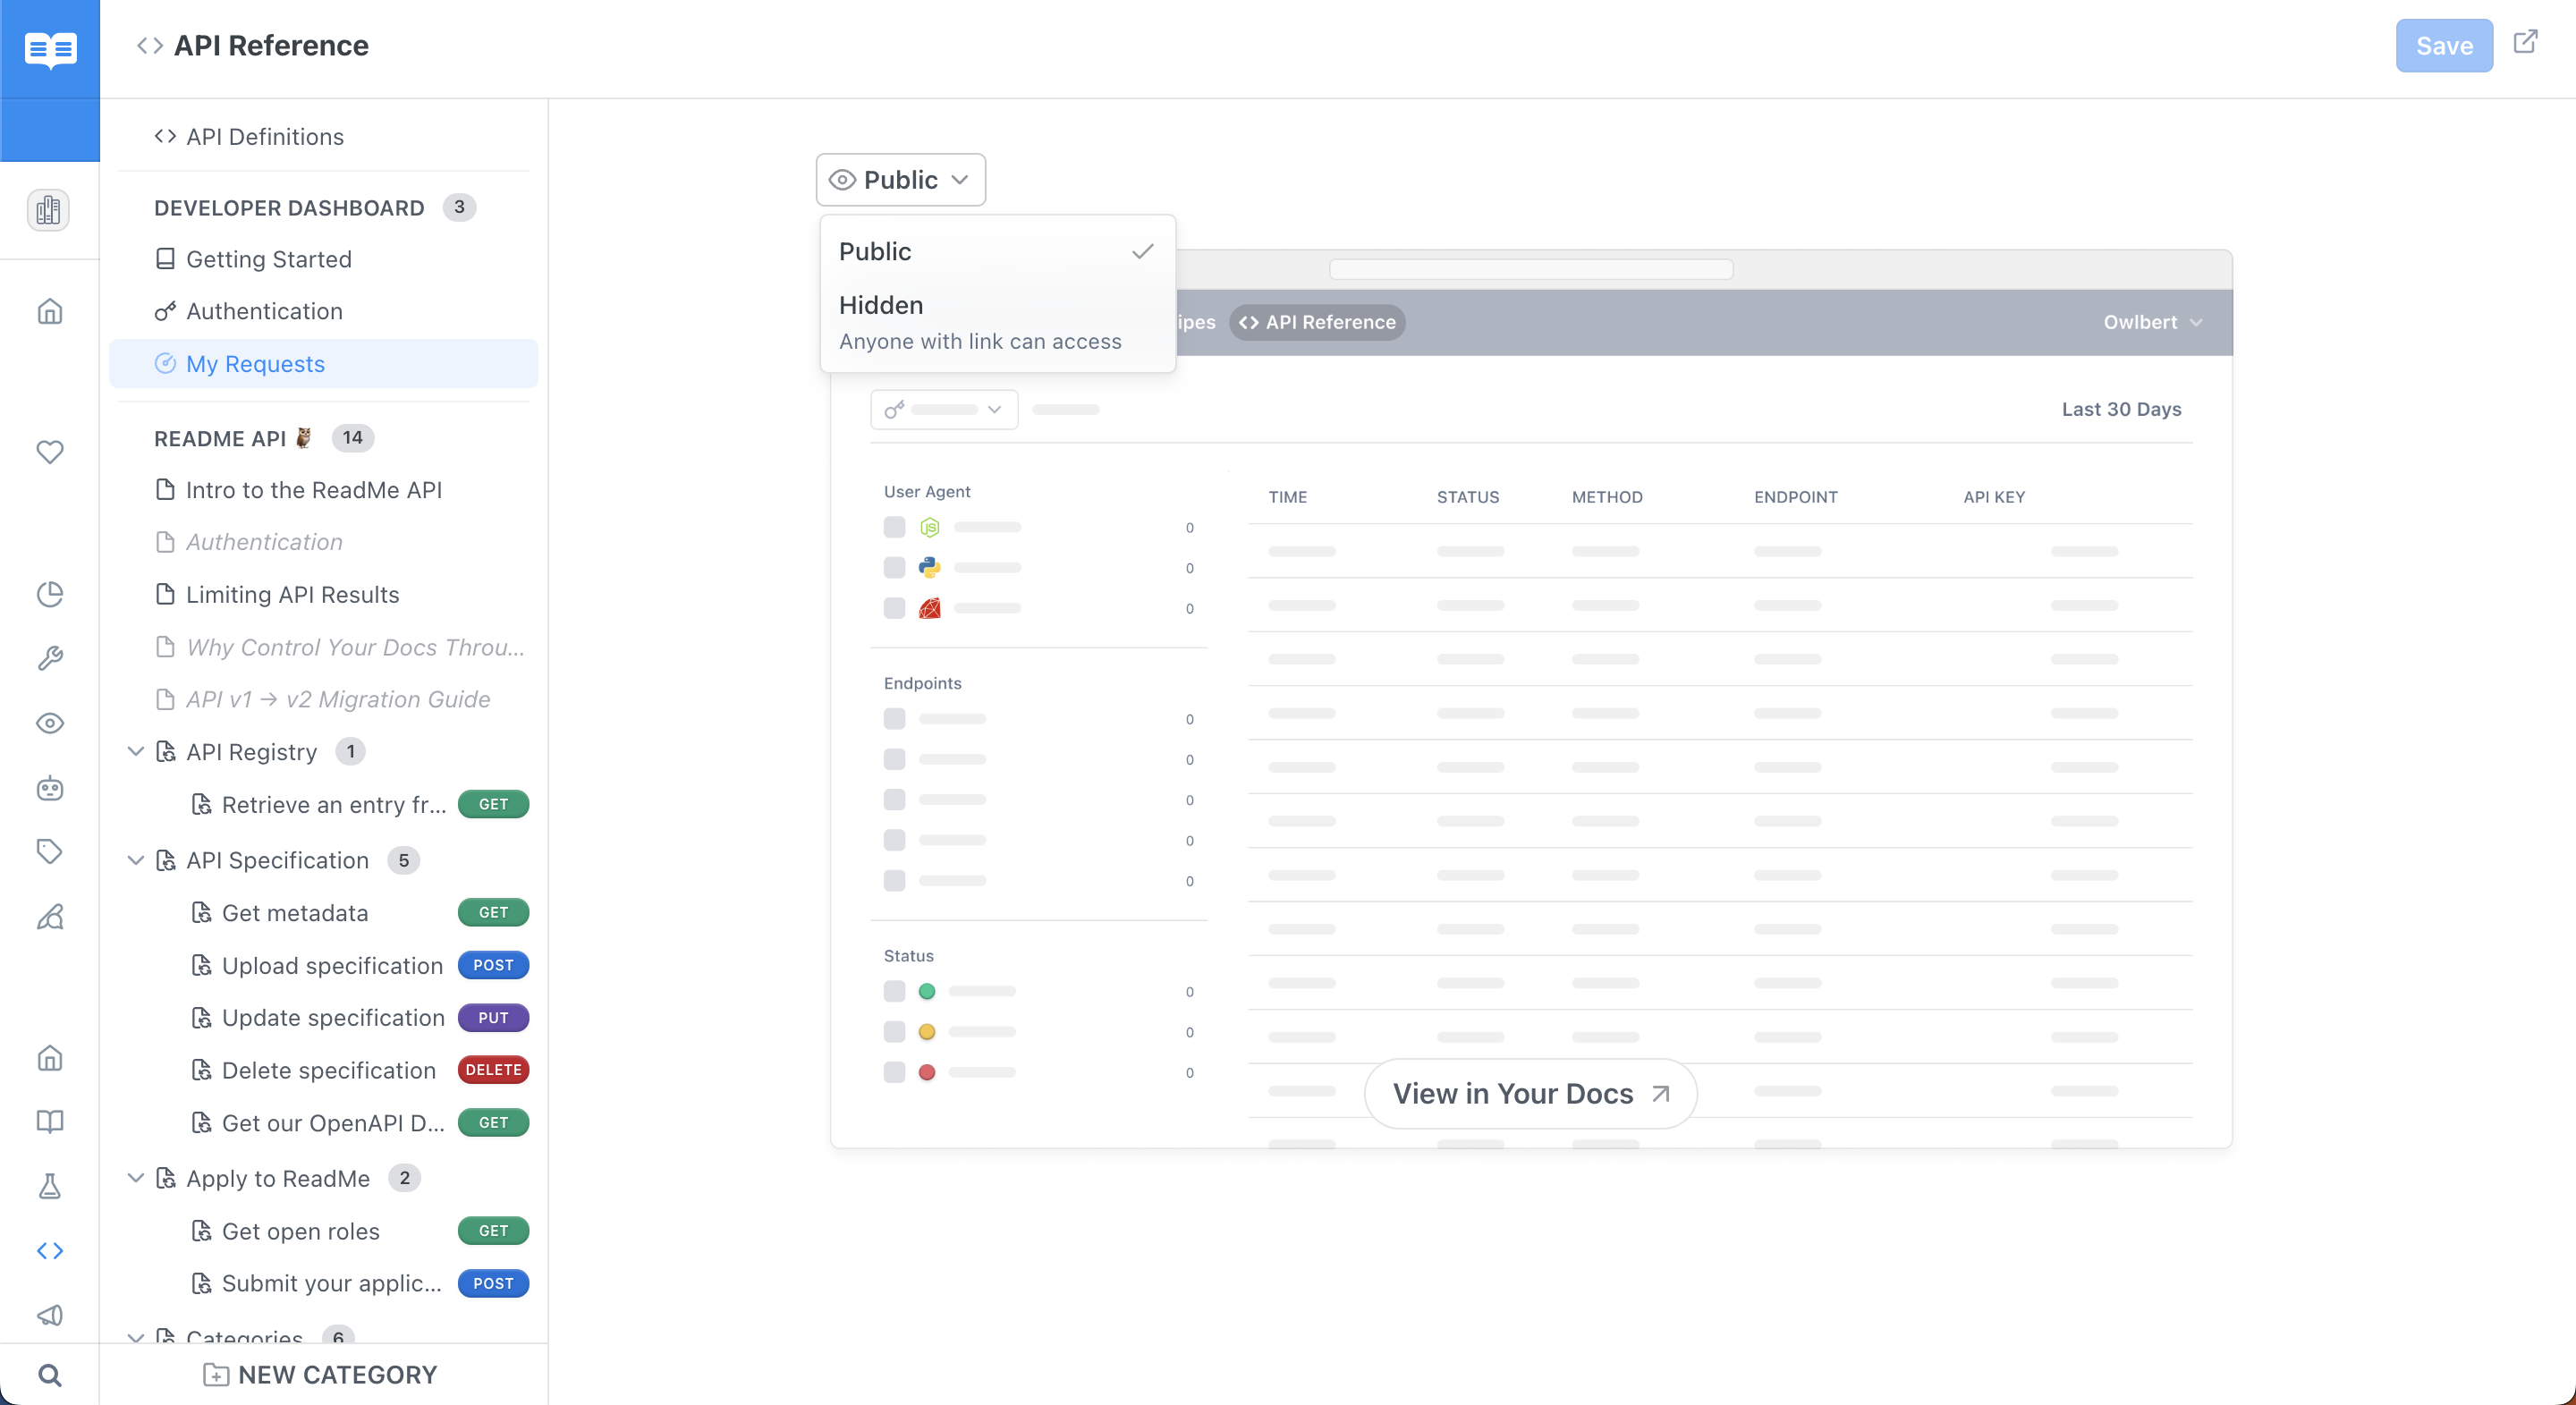
When a logged-in user navigates to the My Requests page, they’ll see a dropdown menu in the top left where they’ll be able to view and toggle between all API keys they have access to.
Additionally, the information adjacent to your API keys dropdown menu highlights total requests made by the selected API key and the request percentage by user agent (which will always total 100%).
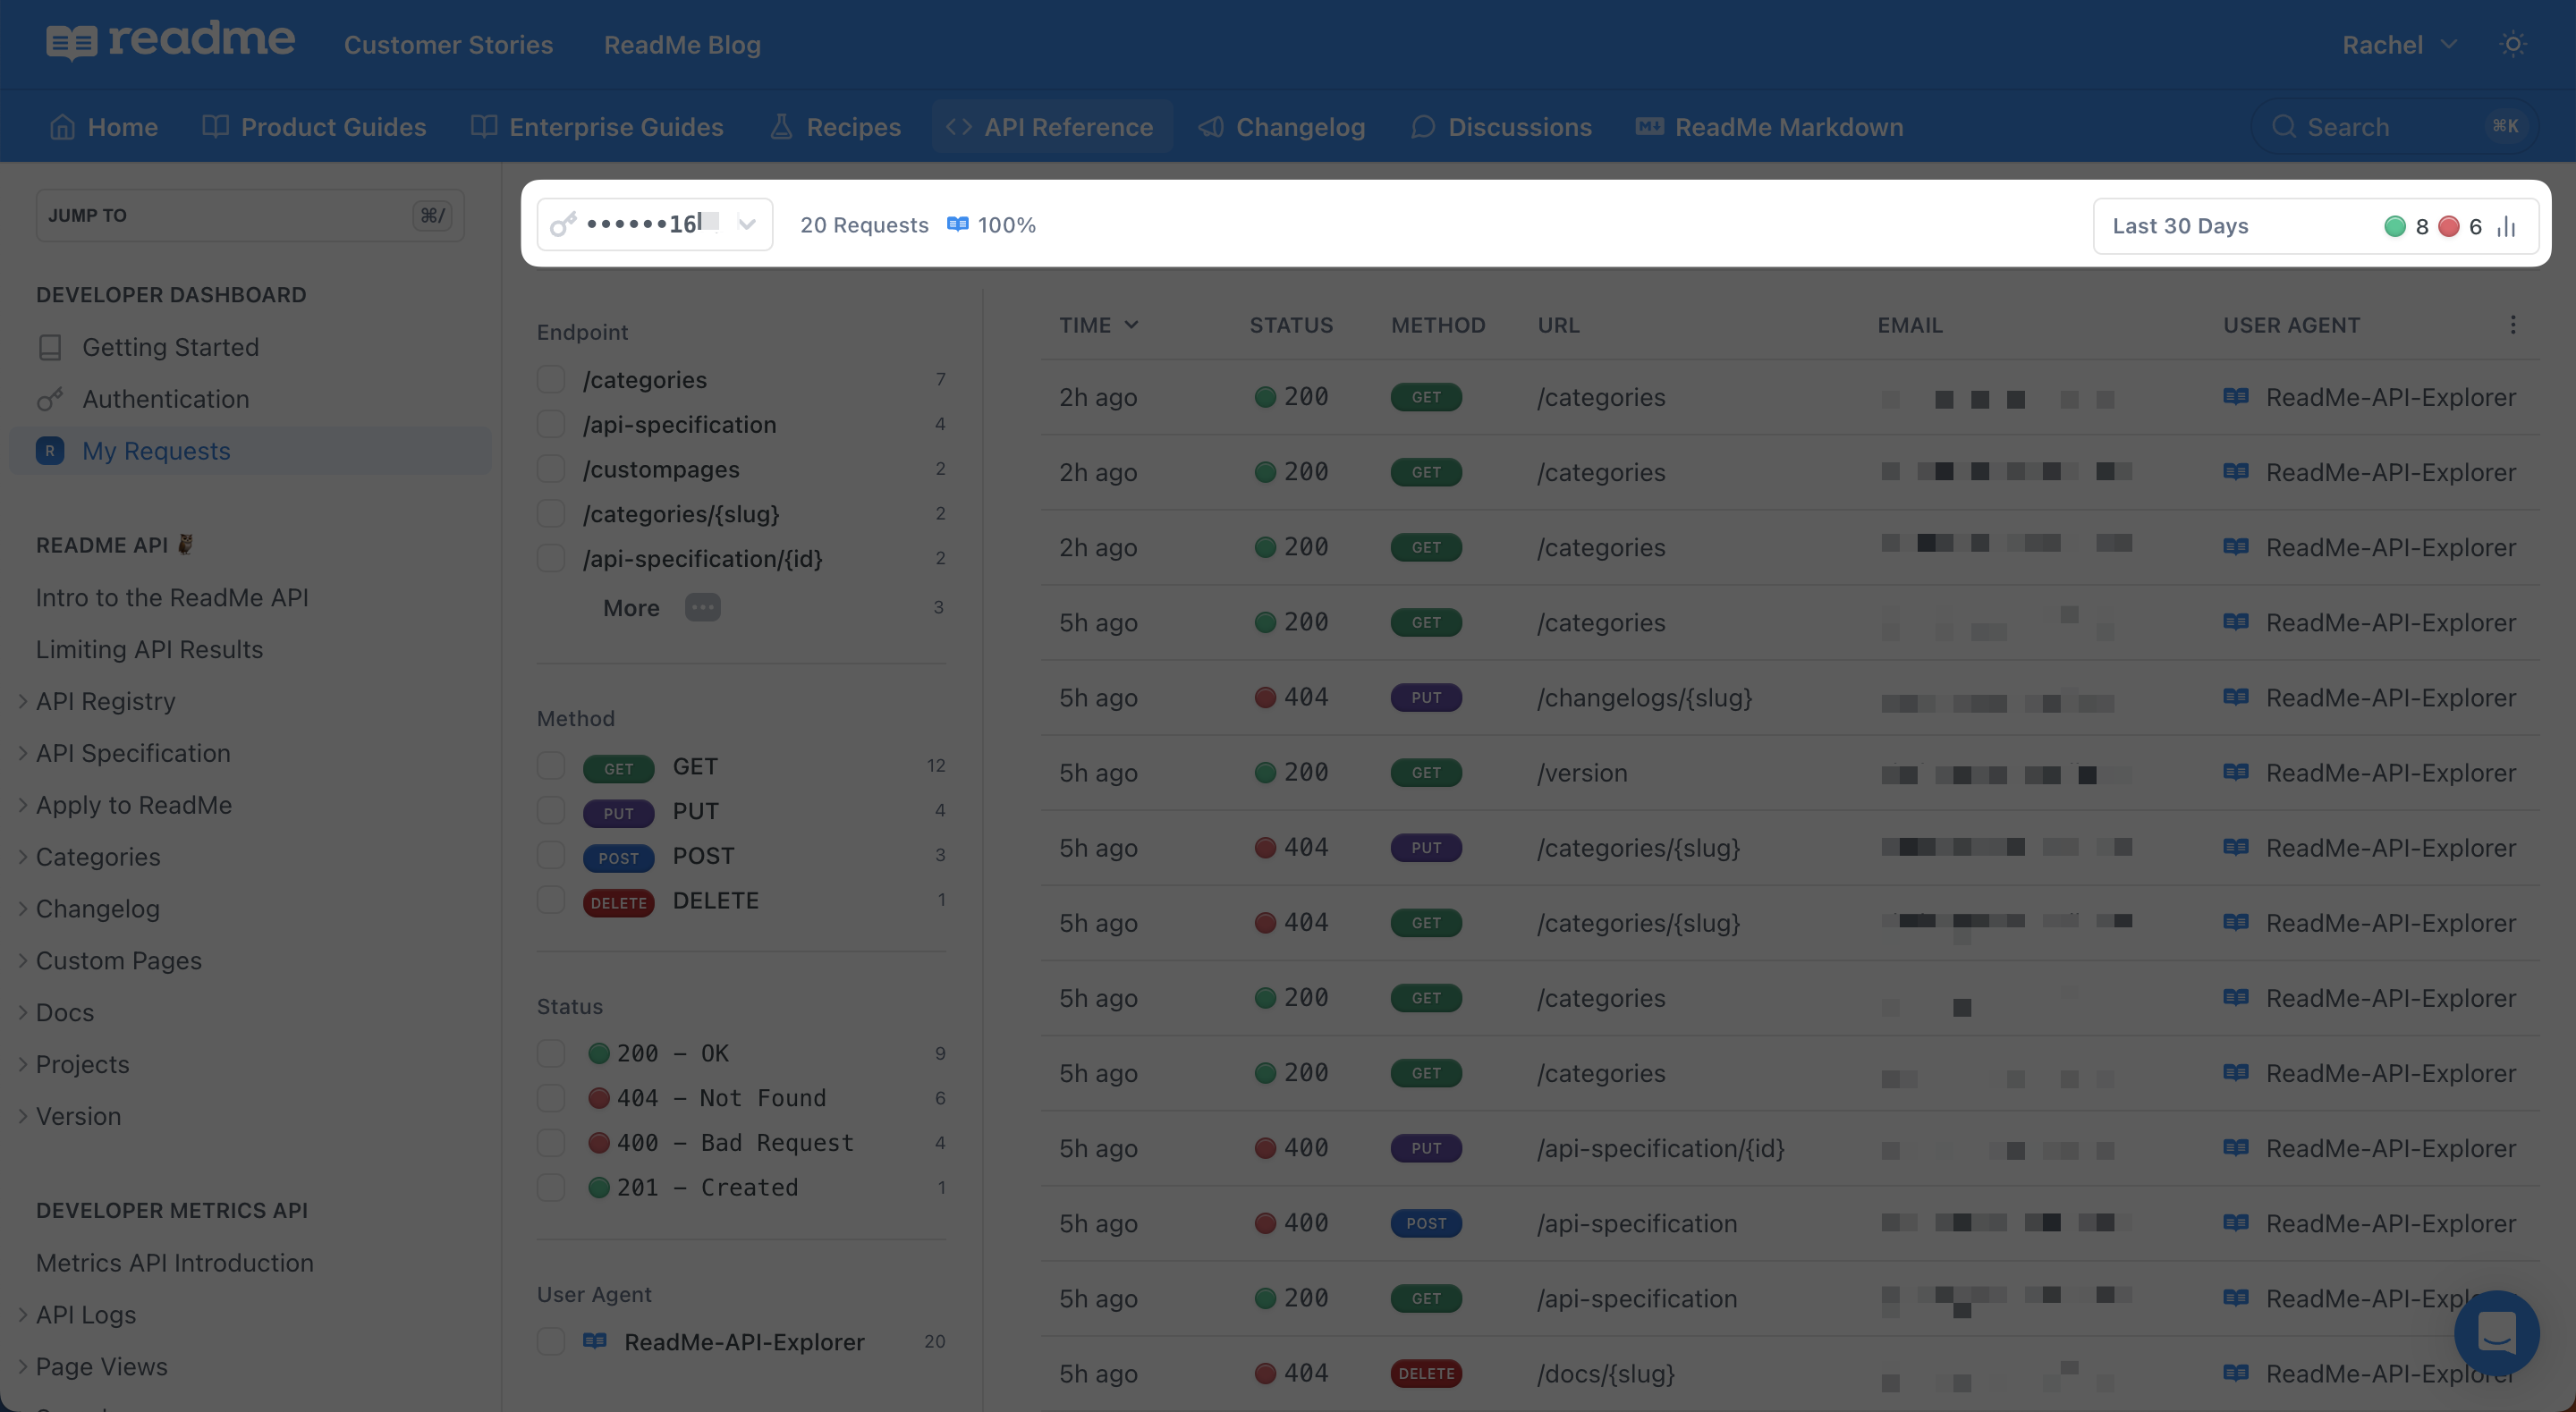
In the top right corner of the page there’s an expandable window that highlights successful calls vs. calls where you hit an error. You can expand the picture-in-picture window to reveal a bar chart that tracks successful vs. unsuccessful calls by date. It’s an easy way to spot a spike in errors and quickly be able to cross-reference that with your logs!
For each API request, users will be able to see when it was made, its status code and method, the endpoint called, the email address of who made the request, and the user agent. Users can also filter requests by these values.
Request History Visibility 🧐
Your ReadMe plan includes 24 hours of API request history in the hub, and if you upgrade to our paid Developer Dashboard plan, your developers will be able to see 30 days of requests, across all API keys.
Debug Right From Your Docs 🐛
At a glance, your My Requests page provides a high-level overview of all of your recent API logs. If you want to dive further into a specific log, you can click any of the fields in a single row to reveal a pop-up menu (we like to call it a Popover 😉) that includes lots more details. This should (hopefully!) provide all of the details you need to troubleshoot a call and figure out what happened.
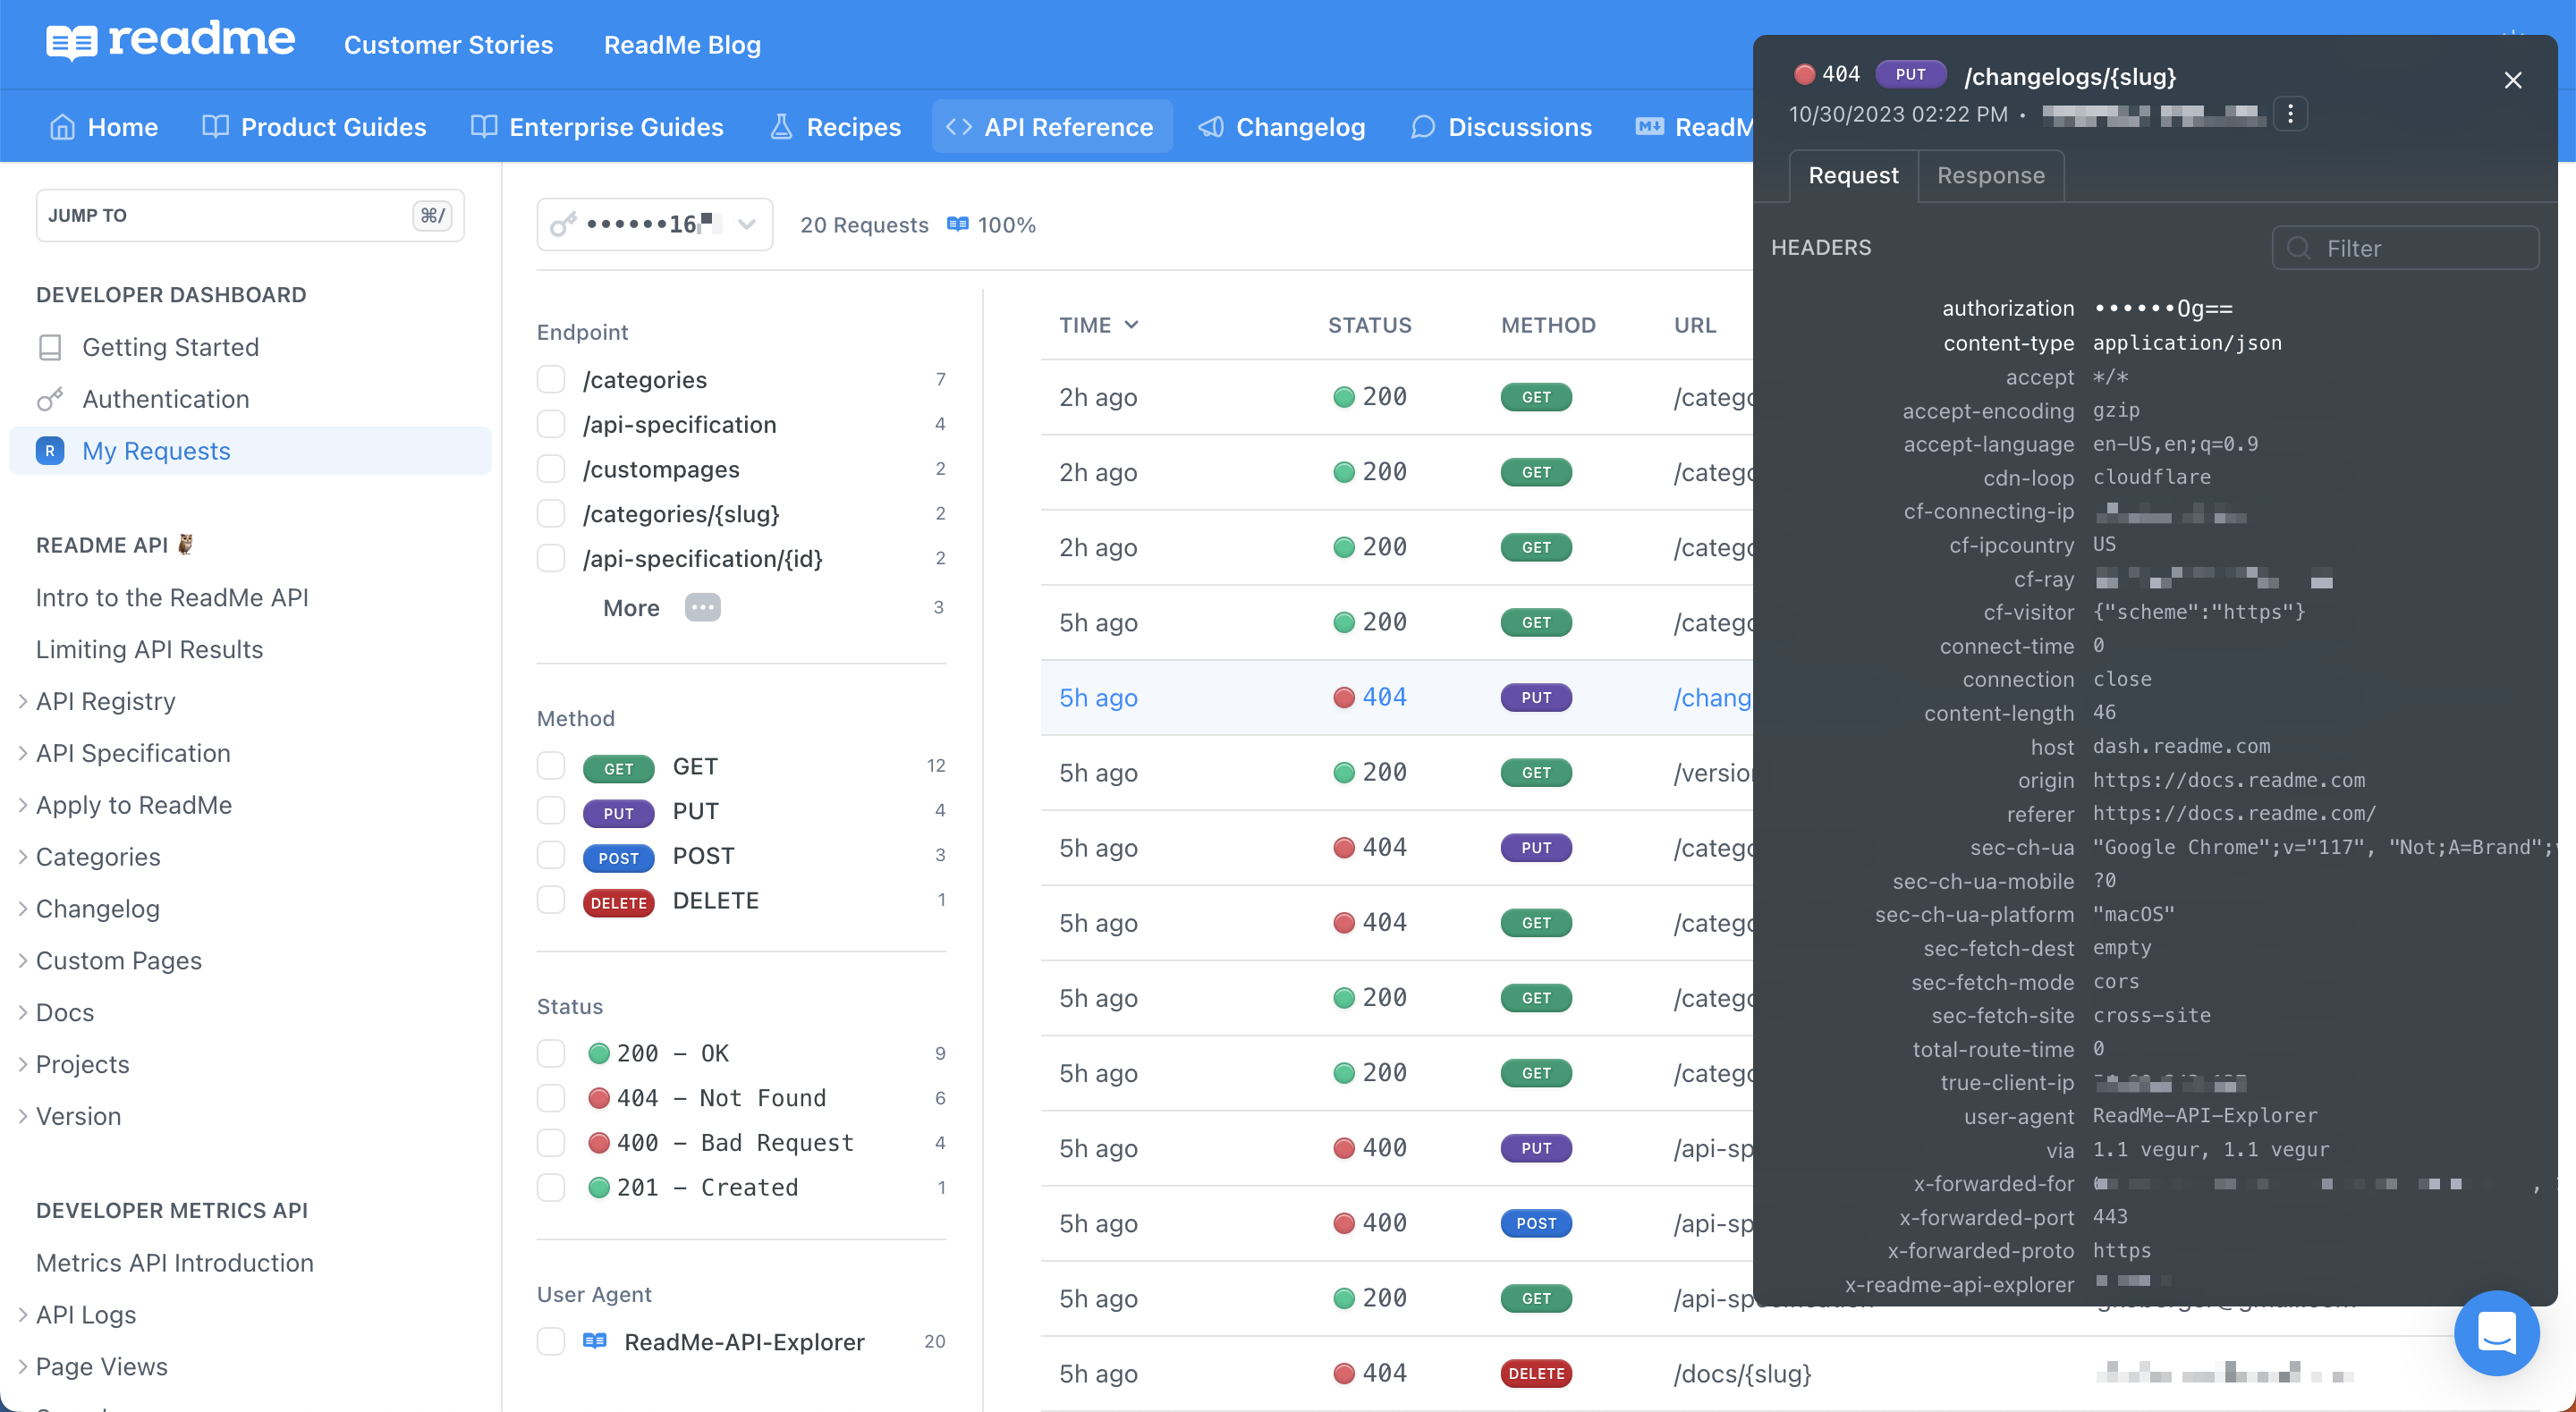
The first tab lists Request Headers. The headers your user sees correspond to the headers you or someone from your team chose to pass through in the uploaded OpenAPI spec (OAS file). You can use the field in the top right to filter through headers. Or, you can pop over (pun intended) to the Response Body and further inspect your API request to understand what went wrong. You can also copy the Response Body in case you want to paste and inspect it in another tool. Additionally, the Copy to cURL Request functionality allows you to copy the documented request and replay it elsewhere.
Setting Your My Requests Page Live
In order to enable the My Requests page for your hub, you need to complete a few preliminary setup steps for your ReadMe project:
- Your ReadMe project must contain at least one OpenAPI file (OAS spec), done via one of our upload methods or using the manual API editor
- You need to complete the Set Up API Keys configuration step by deploying the Personalized Docs Webhook. The setup for this lives nested in the My Developers page in the Developer Dashboard section of your project dashboard
- While not mandatory, we highly recommend sending API logs to ReadMe by integrating the Metrics SDK
Once you’ve completed steps 1 and 2 (and ideally 3, too!), head to the My Requests page in the API Reference section of your project dashboard. This page will always be anchored at the top of your reference section, underneath the Getting Started and Authentication pages. The page will be hidden by default but you can click the dropdown menu at the top, select Public, press Save and the My Requests page will now be live in your hub!
Goodbye API Logs, Hello My Requests
We’ve made the decision to deprecate the API Logs feature in developer hubs in favor of the much more enhanced experience that My Requests provides.
If you previously had API Logs enabled for your hub, the My Requests page will automatically be set live in your hub.
There is no longer an option to toggle API Logs on from your project dashboard’s Site Navigation page. Now, API Requests lives in your dashboard’s API Reference section and you can publish it like any other page!
Updated 5 months ago