

Analytics
Documentation analytics for Enterprise
Enterprise Analytics captures page views, new users, page quality, and search analytics rolled up across all projects.
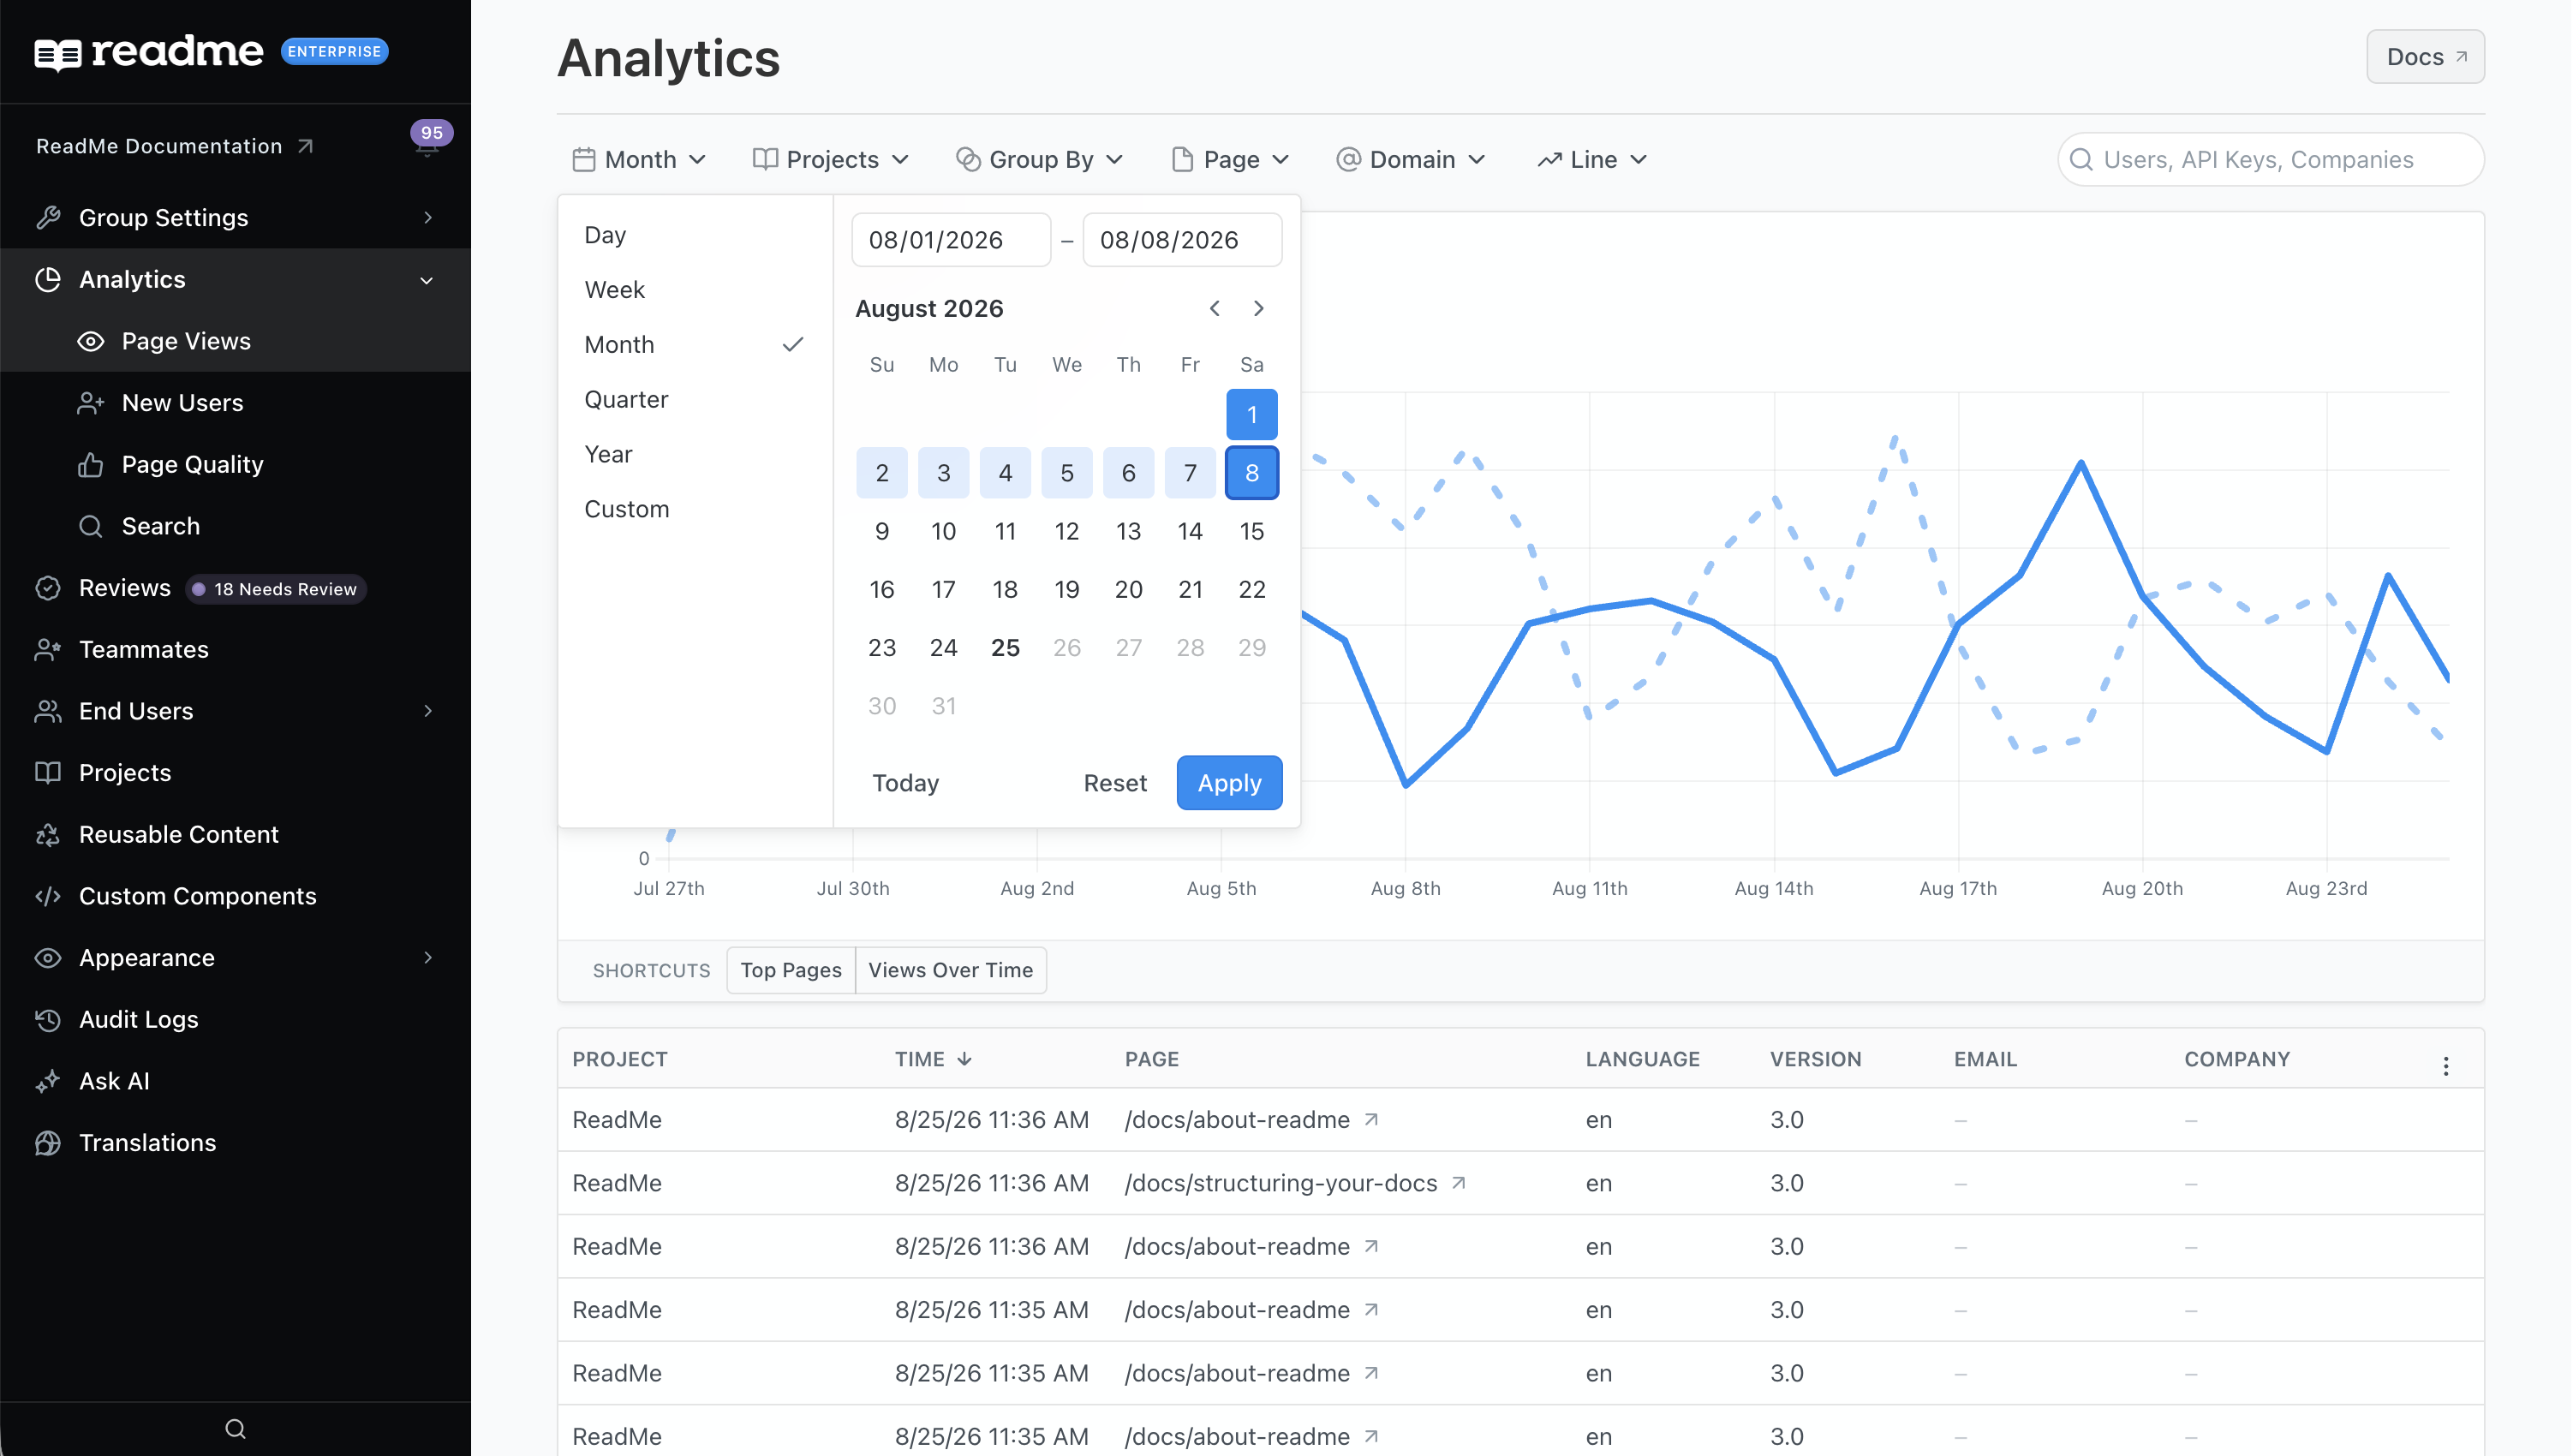
Overview
Enterprise Analytics appear in the Enterprise Dashboard under Analytics. It’s available to all Group Admins and the Group Owner. It can help answer questions like:
- How many users view our documentation?
- What are they searching for?
- Which pages not helpful to users?
- Who’s signed in to our documentation?
Apply Filters
The roll-up includes every project in your group. Add or remove filters to narrow your data to answer questions:
- Time: Limit results to time periods.
- Project: Limits results to a project or set of projects.
- Group By: Depending on the metric, you can group data by properties; like company, page, type, or search term.
- Domain: Exclude specific domains from the data.
- Display: Change between line and bar graphs or compare against the previous time period.
Data
New Users are identified by email address across the group. If the same email address reads two projects, they count as one user. The date they’re counted as “new” is the first time they appear in any selected project.
Identical pages and search terms are combined. If two projects have the same search term or path, they will show the combined count for both. Filter by project to get the count for a specific page or term.
Updated 2 months ago