
Developer Dashboard
Combine personalized, real-time API logs with API documentation. Plus surface your developers’ API keys right in your hub ✨
Developer Dashboard: an API console embedded in your ReadMe dashboard and hub
API teams talk about “Time to First Call” as a north-star metric for their developer experience: how quickly they can engage and enable a new developer to make their first API call.
Making your first API call isn’t just one simple step. There are in fact, quite a few steps to get to this end goal — and many potential pitfalls to encounter. That’s why we’ve overhauled the experience our Admins see in their project dashboards and that your developers see in your dev hubs, to make the entire process simpler for new users and for your API team.
Together, these features make up your Developer Dashboard
Developer Dashboard Foundations
Developer Dashboard encompasses three core pillars that, collectively, power a better developer experience for your end developers and for your API team!
Personalized Docs
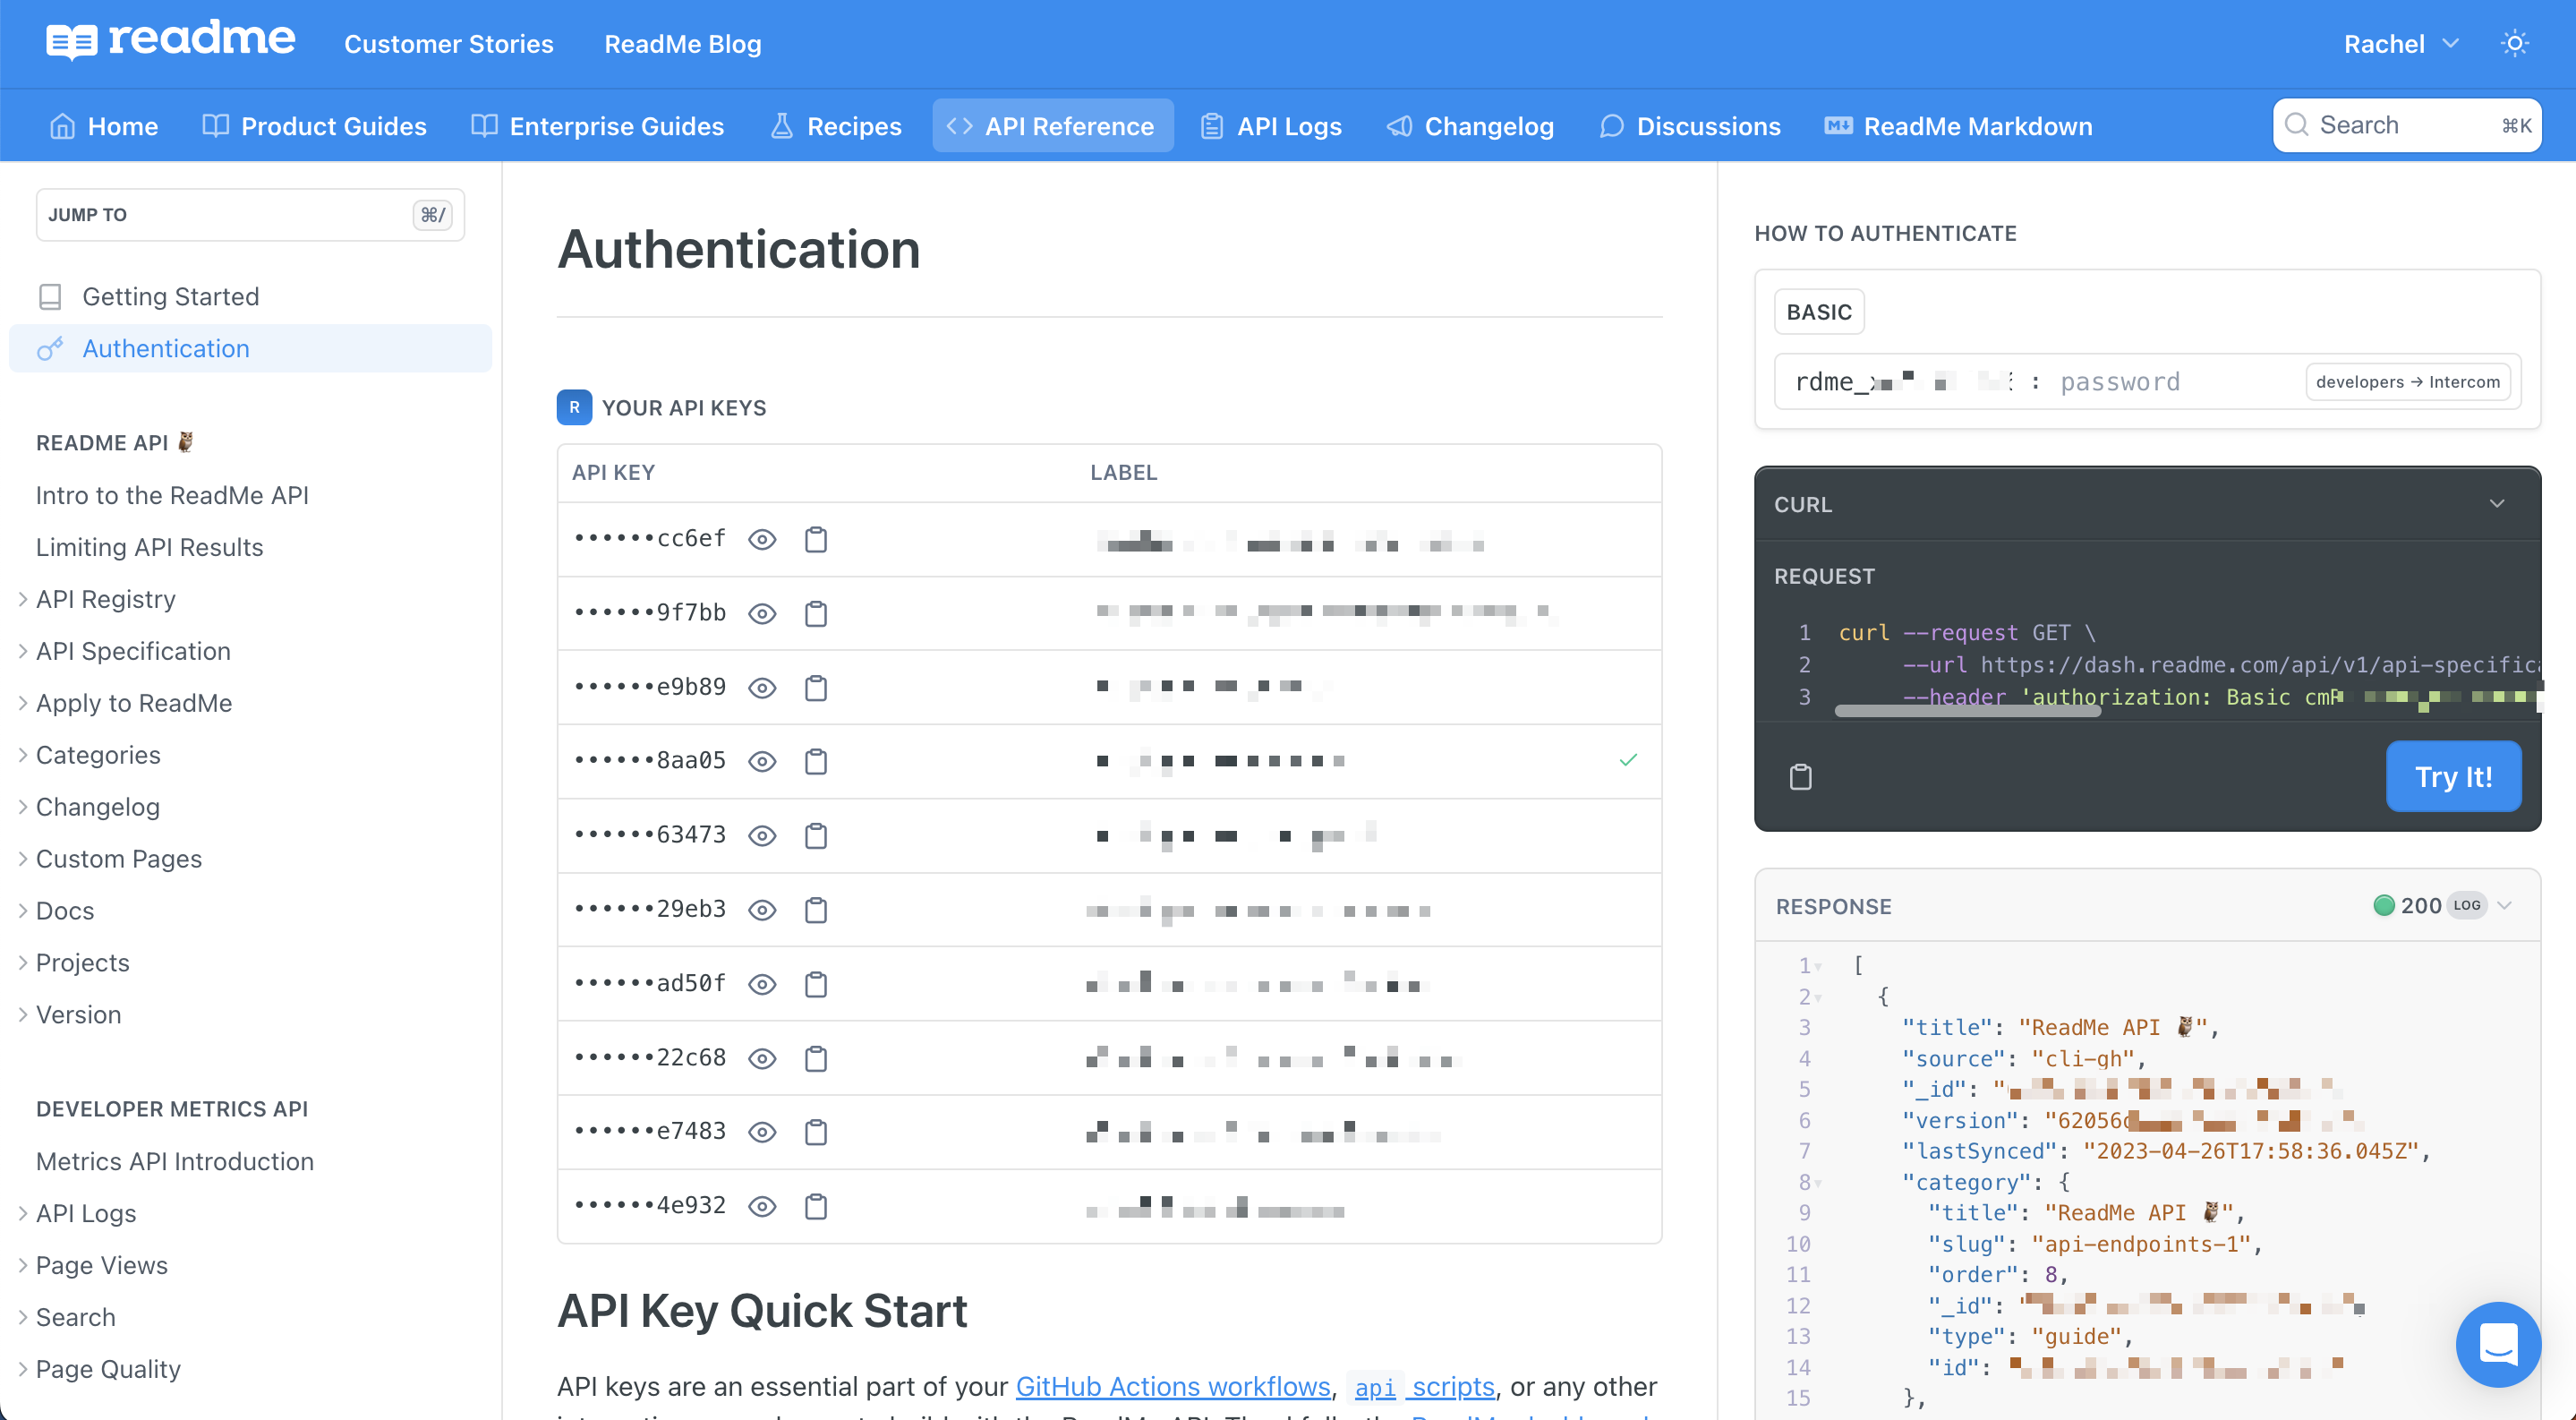
Give logged-in developers instant access to their API keys in your hub so that they can jump right in to making API calls and see responses in real-time. You’ll first need to deploy the Personalized Docs Webhook and set up and publish the Getting Started and Authentication pages in your API Reference. Fortunately, we’ve got guides to walk you through every step of the way in setting that up
Logs in the Hub
In order for your developers to be successful with your API, it’s also important to help them to know when they’ve hit an error. By showing your developers their API logs directly in your hub, they’re able to troubleshoot issues they’re experiencing — without having to navigate away from your hub. You’ll need to integrate the Metrics SDK first in order to show your users their logs in the hub. Fortunately, setup instructions for that, in various languages, can be found here

My Developers
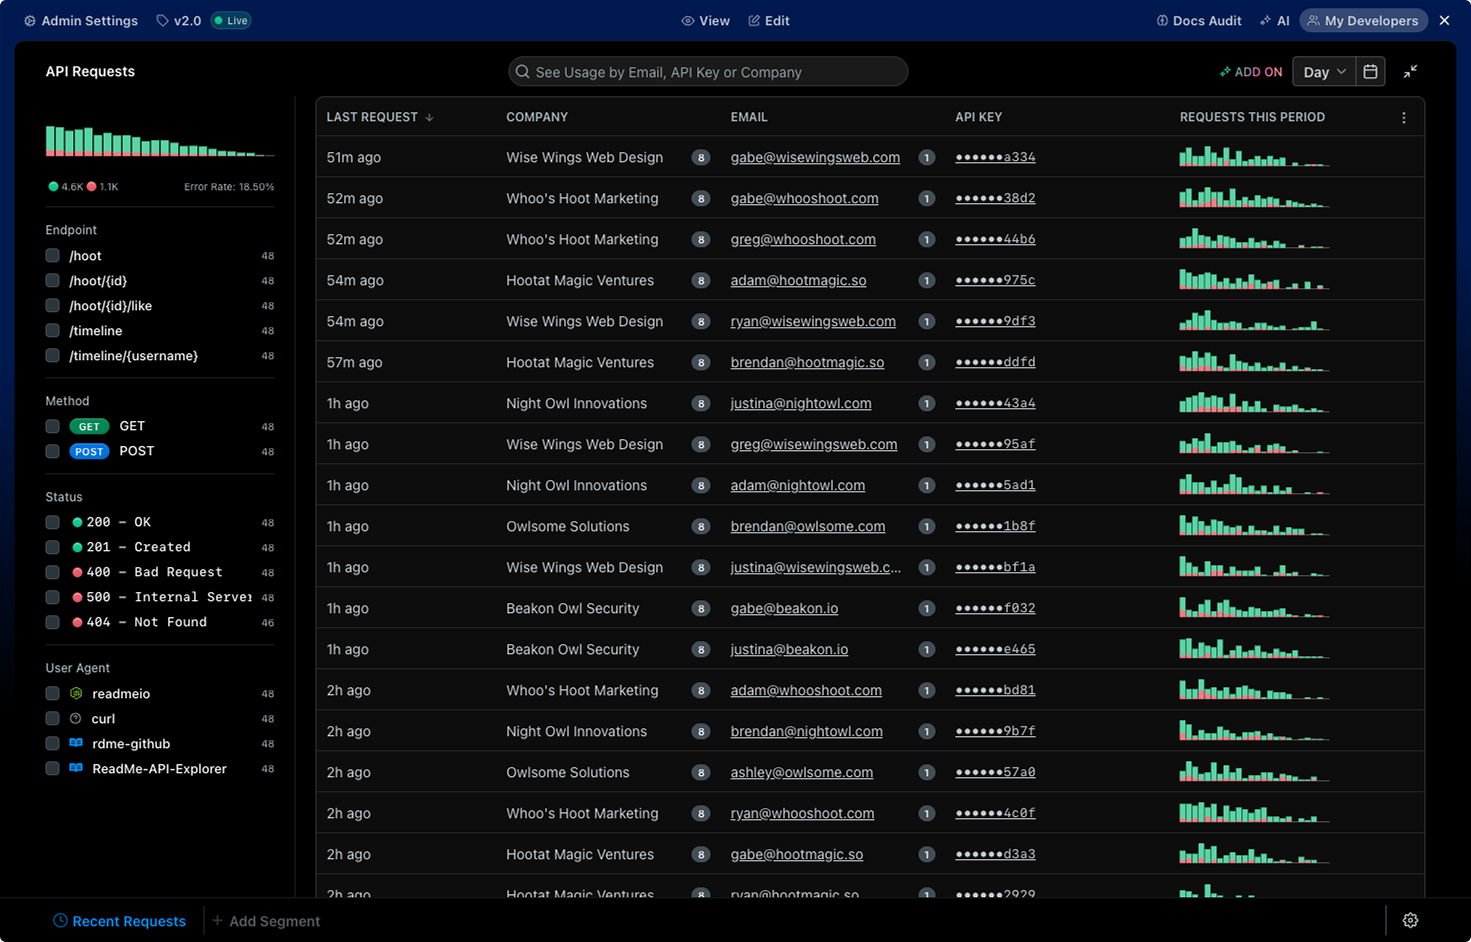
As an Admin, you also want to have insight into how your developers are using your API — to help your developers when they encounter an error, and to have analytics to share with your team. Think of the My Developers page in your ReadMe project dashboard as a behind-the-scenes look at your API users. Here’s where you can investigate API usage in detail (by API key or email) and quickly help users debug issues in their logs. Read on to learn more about setting up this page in your ReadMe project dashboard, and check out this page to learn how to get the most out of your My Developers page.
Benefits of the Developer Dashboard Experience
For ReadMe Admins
We designed the Developer Dashboard experience to streamline and unify the onboarding and setup process for all of the key features that make the personalized developer experience for your end developers possible — Personalized Docs Webhook, Getting Started & Authentication, Metrics (API Logs) SDK. Collectively, these features power the insights ReadMe Admins see in their My Developers page around who’s using their API, when, how, and with what results.
Additionally:
- No need to start from scratch on API documentation “must haves” an Authentication page is VIP(age) to have in your docs to help set your developers up for success out of the gate! Now instead of having to start from a blank canvas, ReadMe offers personalized Getting Started & Authentication page templates that make it super easy to get those pages up & running in a snap!
- Faster developer support tools to diagnose issues Developer Dashboard allows API teams to get on the same page quickly. They can look up users who are encountering errors in My Developers, see their associated API keys, and dig into all their recent logs to figure out what’s happening and debug the issue quickly.
- Track trends with your API over time, spot spikes in errors, see who’s a new user, & more get insights into API usage over time to understand your API use cases, e.g., which endpoints are getting the most use and where users are running into issues, and use these insights to inform your future API roadmap and/or spot bugs and urgent fixes.
- Monitor cohorts of users, send comms to specific groups, and create segments with My Developers filter your My Developers page by endpoint, method, status, and more. Search for a user by API key, email, or company. See trends in data over a day, week, month, quarter, and year. Plus, create and save segments for easy reference and to better track issues.
For Your End Developers
Surfacing your developers’ API keys in you hub gives your end developers the tools to make their first API call quickly and seamlessly. Additionally, by providing them with personalized access to their API logs, they can use their most recent activity to quickly debug issues.
Additionally:
- Provide better engagement and support your developers have what they need to build efficiently, and you’re giving them the necessary info to debug issues when they (inevitably) run into roadblocks.
- Lower the on-ramp for new API users and give your end developers access to API keys instead of sharing convoluted instructions on how to get an API key from somewhere else, or causing your developer to switch between browser tabs, surface API keys to users front & center once they’re logged in to your hub.
- Provide valuable and easily accessible self-serve debugging tools for your developers instead of needing to write into support, your developers can access their logs in the hub to dig into issues themselves!
Getting Started with Developer Dashboard
In order to enable the full Developer Dashboard experience — for your team and for your end developers — and to unlock the full insights available with My Developers, you’ll first need to complete a two-part onboarding flow.

Check out our quick start video below if you want to see this onboarding flow in action:
Authentication
In the first part of the Developer Dashboard setup, you’ll walk through the process to authenticate logged in users in your hub so that they can see their API keys. This step is where you’ll deploy the Personalized Docs Webhook.

For the full instructions on configuring and deploying the Personalized Docs Webhook, head to this page in our docs. Once you’ve deployed the Personalized Docs Webhook, you’re well on your way to setting up the Getting Started and Authentication pages in your hub. After deploying the Personalized Docs Webhook, you can always return to the Set Up API Keys page in the Developer Dashboard section of your project dashboard to edit configuration and see the variables that have either been pulled automatically from your API definitions or that you’ve manually configured.
The Personalized Docs page in the Configuration section of your project dashboard also shows all of your server, security scheme, and custom variables. From this page you can also click the Setup button in the top right to navigate back to the Set Up API Keys page.

API Logs
In the second, and final, portion of the Developer Dashboard setup process, you’ll integrate the Metrics SDK to send API logs to ReadMe. This allows both you and your team, as well as your developers in the hub, to view API insights such as top endpoints and call volume.

You can integrate the Metrics SDK in a number of languages, including Node, PHP, and Python. For full instructions on how to send API logs to ReadMe by integrating the Metrics SDK, head to this page.
And that’s it. Once you’ve completed setup for both Authentication and API Logs, you’ll see your My Developers page and be able to get to know your end developers — and how they’re using your API — even better
Further Reading
- For more information on My Developers, and how to get the most out of your API insights, check out this page
- For more information on deploying the Personalized Docs Webhook to surface API keys in the hub to your logged-in developers, check out this page
- For more information on integrating the Metrics SDK to send API logs to ReadMe and allow your developers to see their real-time API request history in your hub, check out this page
- For information on Metrics pricing and how to add more logs to your plan so that you can view more history, check out this page
Updated last month