

MCP Metrics
See which tools AI agents call on your MCP server, how fast those calls return, and what they asked for.
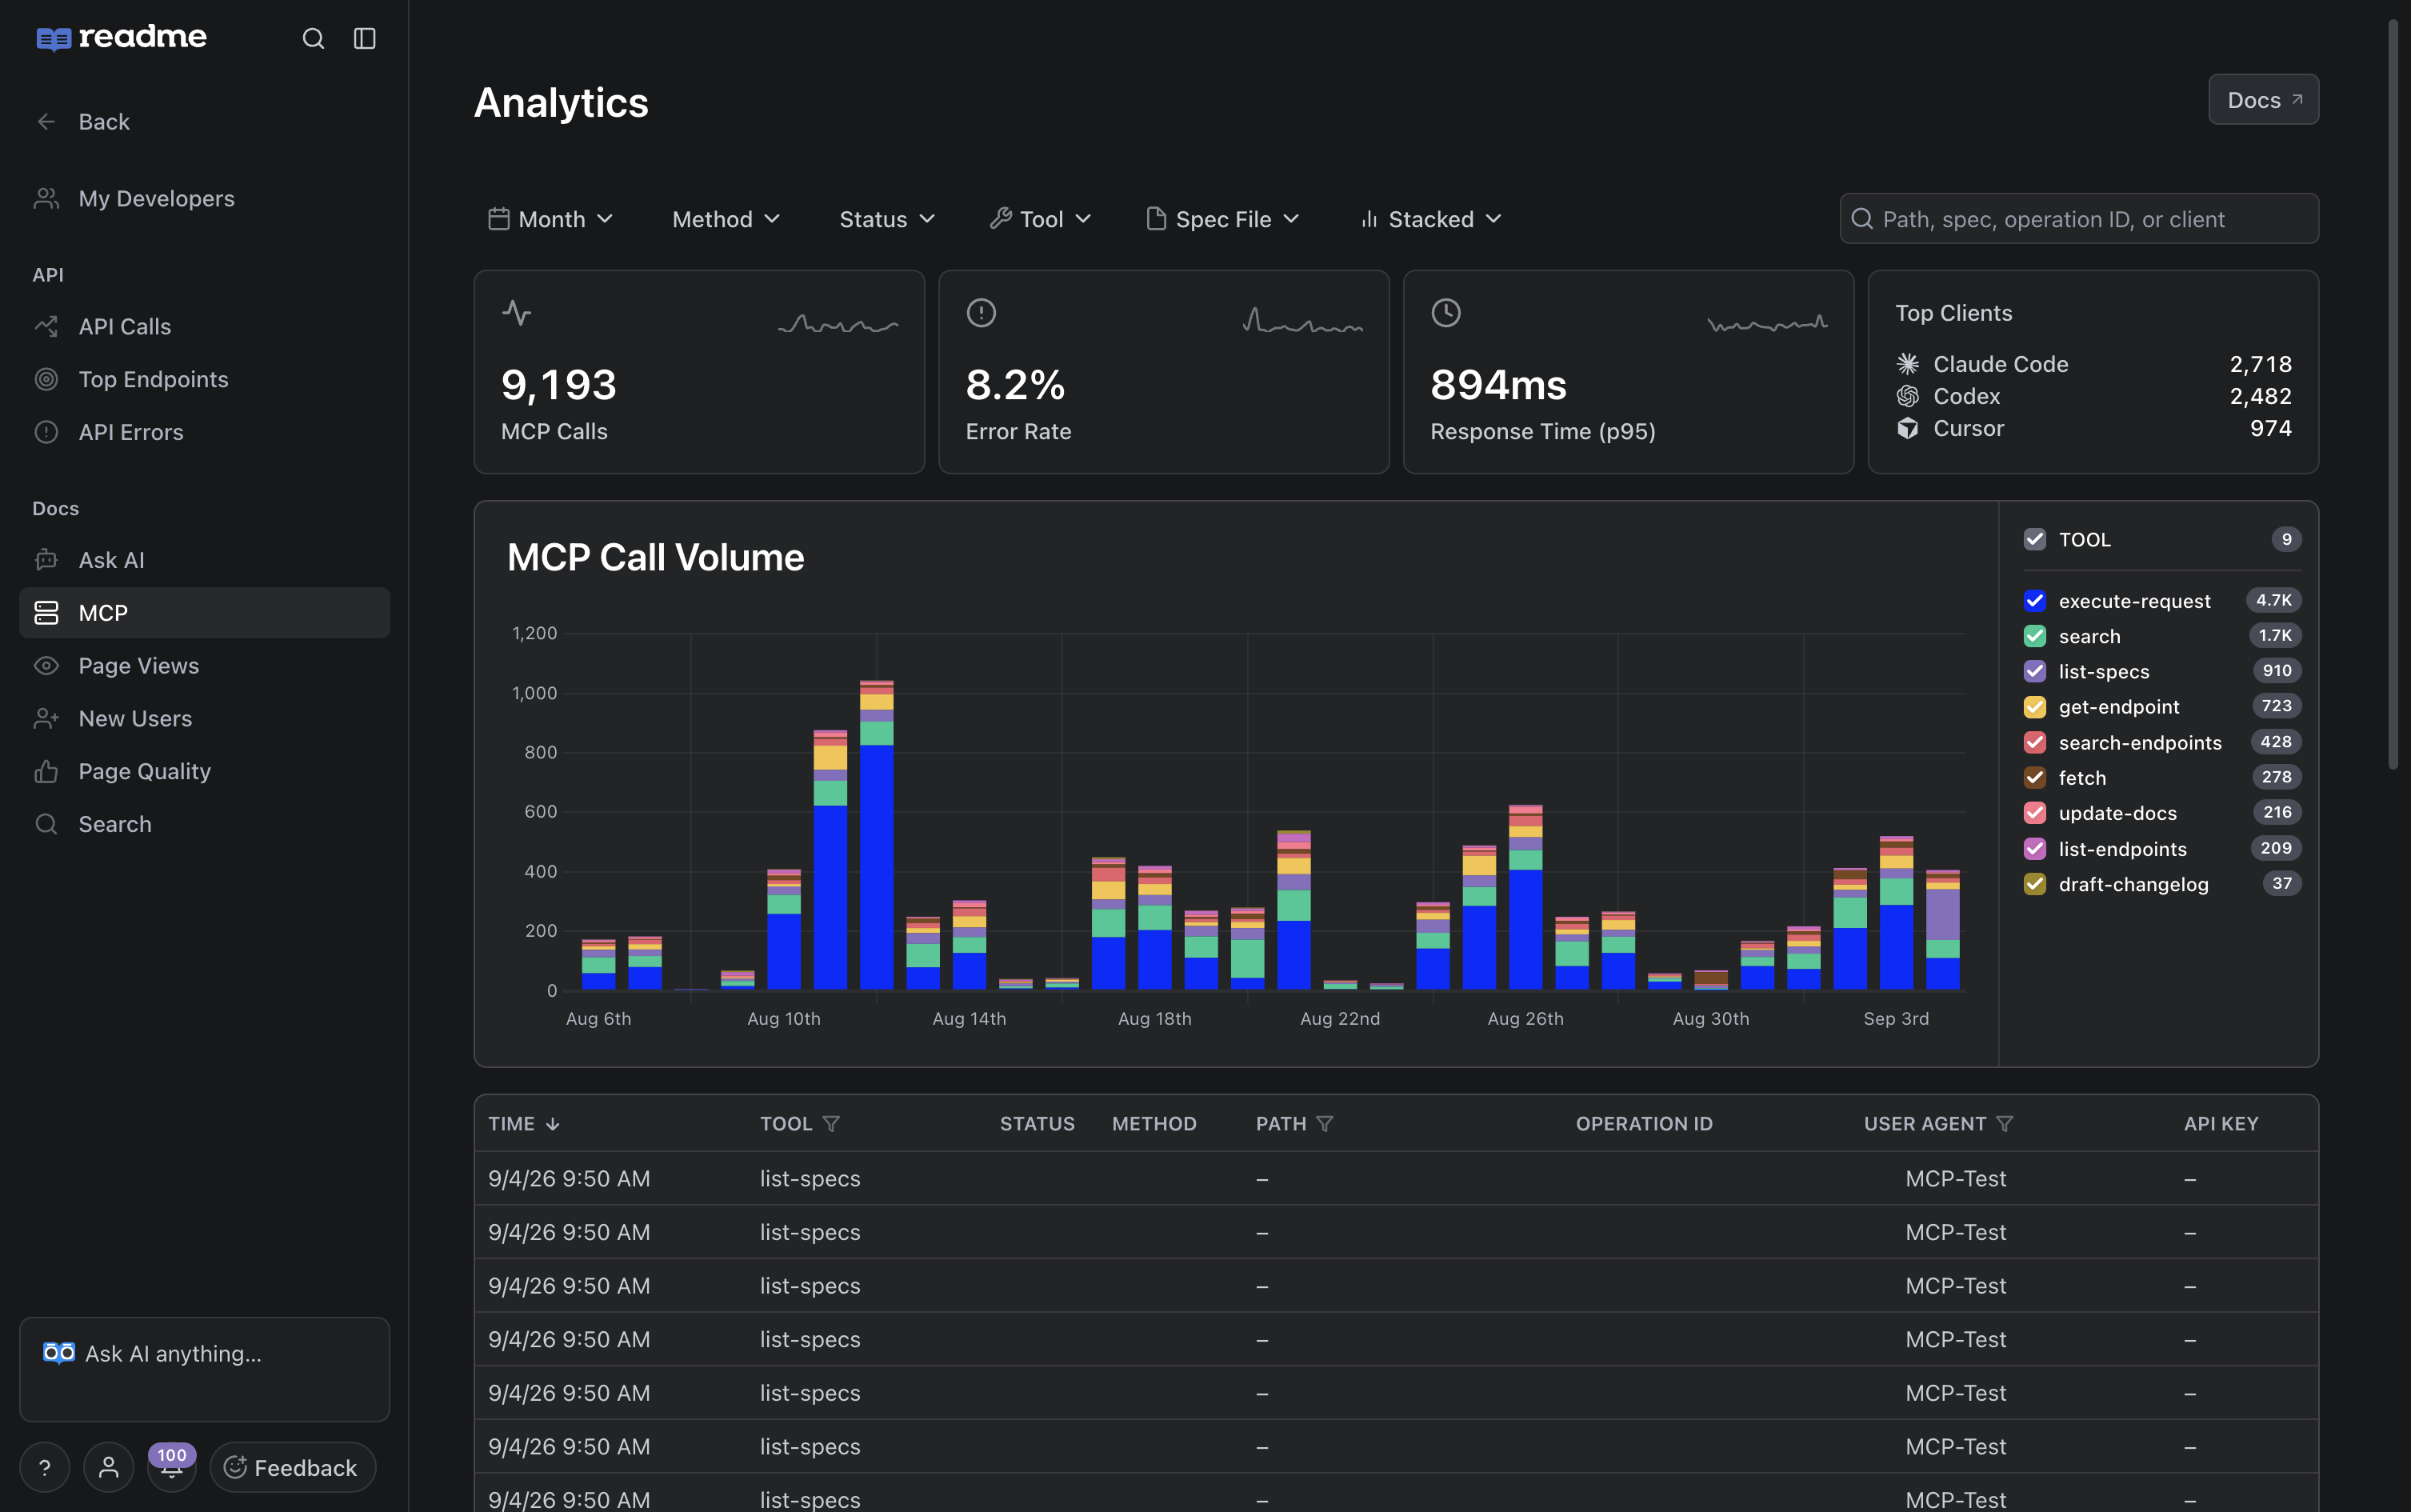
Every time an AI client calls a tool on your project's MCP server, ReadMe records the call. The MCP page in Analytics shows how many calls arrived, how quickly they returned, how many failed, and the query or endpoint behind each call.
Use these metrics to identify the tools agents use, the endpoints they request, and the errors they encounter.
Getting Started
- Open your project in ReadMe.
- Go to Analytics → Docs → MCP.
- Pick a date range at the top of the page.
- Filter the table by the tool, method, status, or spec you want to investigate.
If your MCP server is off, the page tells you and links to AI > MCP, where you can turn it on. ReadMe does not record calls while the server is off.
Summary Cards
Four cards appear at the top of the page, each with a sparkline for the selected range.
- MCP Calls — Total number of MCP calls in the range.
- Error Rate — Percentage of calls that returned a
4xxor5xxstatus. - Response Time (p95) — 95th-percentile response time. The tooltip also shows the median.
- Top Clients — AI clients that made the most calls, such as Claude and Codex, with the number of calls from each client.
MCP Call Volume
The call-volume chart shows calls per day, grouped by tool. It plots the five busiest tools by default. Use the Tool control on the chart to change the grouping.
Tool Calls Table
The table lists every call, newest first. These columns are visible by default:
| Column | What it shows |
|---|---|
| Time | When the call arrived. |
| Tool | Which tool the agent called. |
| Status | HTTP status returned by the tool. |
| Method | HTTP method, for tools that call an API endpoint. |
| Path | Endpoint path resolved by the tool. |
| Operation ID | The operationId from your API definition. Click it to open the matching reference page in a new tab. |
| Response Time | How long the call took, in milliseconds. |
| Query | Search string, for tools that accept one. |
| Results | Number of results returned by the tool. |
| Spec File | API definition used by the call. |
| User Agent | User agent sent by the client. |
| API Key | The API key used to authenticate the call, masked to show only the last four characters. |
Filtering
The controls above the table filter the cards, chart, and rows at the same time.
- Search — Matches path, spec file, operation ID, slug, user agent, and query.
- Method — Filters by one HTTP method.
- Status — Filters by status class, such as
2xx,4xx, or5xx. - Tool — Filters by one built-in tool.
- Spec File — Filters by one API definition.
- Reset Filters — Appears after you apply a filter and clears all filters.
Individual columns have additional filters behind the funnel icon in the header. Tool, Path, Query, Spec File, User Agent, and Trace ID accept a substring. Response Time and Results accept a minimum, maximum, or both. Filters apply after a half-second pause; press Enter to apply one immediately.
To filter for a custom tool, open the funnel on the Tool column and enter its name.
Built-in Tools
The Tool column and dropdown use these names for built-in tools:
| Tool | Description |
|---|---|
search | Searches your guides. Requires Ask AI. |
fetch | Fetches a page. Requires Ask AI. |
search-endpoints | Searches your API endpoints. |
list-endpoints | Lists endpoints in a spec. |
get-endpoint | Returns details for one endpoint. |
list-specs | Lists your API definitions. |
get-server-variables | Returns server variables for a spec. |
execute-request | Makes a live request to your API. |
send-feedback | Submits feedback about your APIs or docs. |
Turn off individual tools under AI > MCP → Built-in Tools. Calls to custom tools also appear in the table under their configured names.
Enterprise Group Metrics
On Enterprise plans, tools that run across all child projects (i.e. search, list-specs, and search-endpoints ) rather than targeting a single one do not take an API spec as input, so when called from the group MCP URL they operate at the parent level.
ReadMe records these calls against the group (parent) project only, not against each child project individually. This means:
- Group-level metrics show the total call count for tools that span all children.
- Child-project metrics show only calls that targeted that specific project — for example, calls made via
?projects=fooor tools likeget-endpointthat resolve to a single spec.
To see group-wide tool calls, open the MCP metrics page from your Enterprise parent project.
FAQ
How far back does the data go?
Use the range picker to select the last 24 hours, 7 days, 30 days, 12 weeks, or 12 months. You can also set custom start and end dates. MCP ranges are not capped by your Metrics plan.
Why is my MCP call count zero?
Your MCP server is off, or no client has connected to it yet. The page identifies which case applies and links to the setup page.
Does this count sessions or conversations?
No. Each row represents one tool call. Top Clients shows the clients that made the most calls and their call counts, not session or conversation counts.
Do calls from my own testing show up?
Yes. ReadMe records any call that reaches your MCP server, including calls from your own test client. Use the user agent and API key columns to distinguish your traffic from other clients.
What plan do I need?
MCP Metrics is available with the Ask AI Addon. The search and fetch tools require Ask AI; the other tools do not.
Updated 14 days ago